As the chairman of the Shoestring Foundation reported, OpenStreetMap has got a terrible data format. I've gladly received a copy of the precious data in as a LIST. Similar to my adventures with plotting elevation data, I now want to plot all the cities, towns, villages and hemlocks of Germany.
So since we already have an easy way to doodle on a canvas, let's fire up our scheme interpreter! Simple things first:
(use numbers doodle)

; get from http://pestilenz.org/~ckeen/staedte.sexpr
(define cities (with-input-from-file "staedte.sexpr" read))

(define coord second)
(define get-x first)
(define get-y second)

(define blue (list 0 0 1 1))
All the data points are saved in angles of latitude and longitude. There is a plethora of ways to project these spheric coordinates onto a plane. Since I will be covering a very small spot of the whole earth I thought that a simple Mercator projection will do just fine. (Also it is easily done.)
Thus I wrote:
(define +pi+ 3.14159265358979323846)
(define (->radians x) (* x (/ +pi+ 180)))

(define mercator-x ->radians)
(define (mercator-y y)
  (let ((tany (tan (->radians y))))
    (log (+ tany (sqrt (+ (* tany tany) 1))))))
Now that will get me coordinates of the plain projection, which I then need to map back to coordinates of my canvas. I have met an old acquaintance of mine called scale which does the job. I have to parse all the points once (or twice if you do it naively as I do here for readability) to get the minimum and maximum coordinates.
(define min-x (mercator-x (fold (lambda (c s) (min s (get-x (coord c)))) most-positive-fixnum cities)))
(define max-x (mercator-x (fold (lambda (c s) (max s (get-x (coord c)))) 0 cities)))

(define min-y (mercator-y (fold (lambda (c s) (min s (get-y  (coord c)))) most-positive-fixnum cities)))
(define max-y (mercator-y (fold (lambda (c s) (max s (get-y  (coord c)))) 0 cities)))

(define (scale val min max mapped-min mapped-max)
  (* (+ mapped-min (- mapped-max mapped-min))
     (/ (- val min)
        (- max min))))
Now the actual drawing becomes a piece of cake! Quickly make a new doodle, and iterate over all the points, scale them accordingly and draw a little circle at the resulting coordinate.
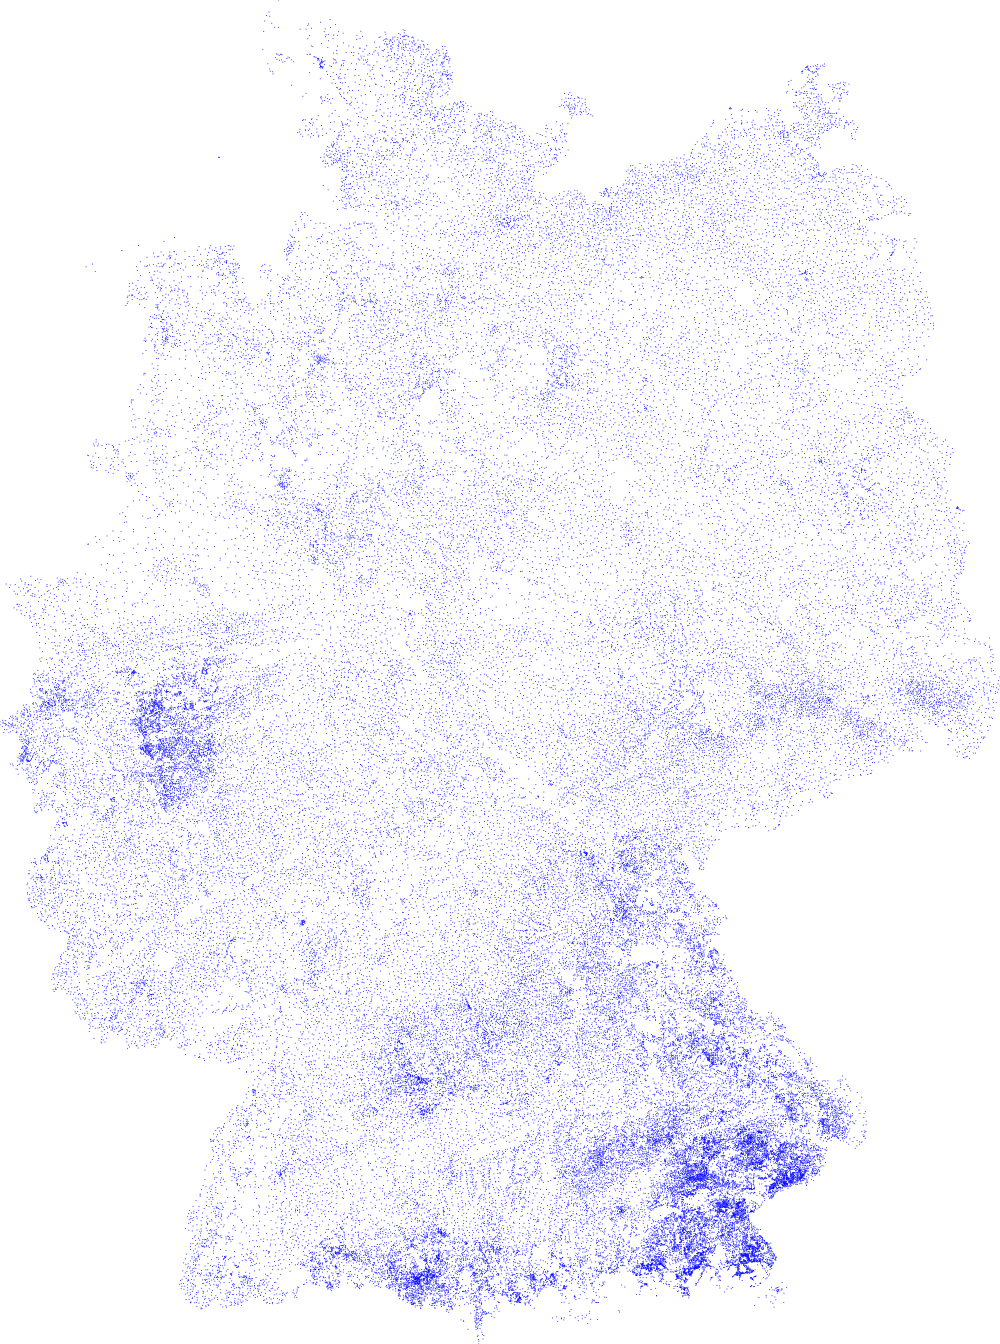
(define aspect (/ (- max-x min-x) (- max-y min-y)))

(define-constant +width+ 1000)
(define-constant +height+ (inexact->exact (round (/ +width+ aspect))))
(define-constant +radius+ 1)

(new-doodle background: solid-white width: +width+ height: +height+)

(for-each (lambda (c) (let* ((xy (coord c))
                             (x (get-x xy))
                             (y (get-y xy))
                             (scaled-x (scale (mercator-x x) min-x max-x 0 +width+))
                             (scaled-y (scale (mercator-y y) min-y max-y 0 +height+)))
                        (filled-circle scaled-x (- +height+ scaled-y) +radius+ blue)))
          cities)
(show!)
E voila! (click the image to see it in full size).
If you find some interesting ways to draw the same database I would love to hear about it!
Yours truly,
C-Keen