Last holiday we have been hiking at the nothern edge of the alps. I have used a Garmin Geko GPS device to log this trip and I want to visualise the data now. I am interested in printing the height along the time scale we have been travelling.
Getting the data
I could use a plethora of available mapping software which really does a great job, including something like Google Earth, but most of the alternatives I have looked at had strange export formats. It is easy to get data in, getting data out being near to impossible with some alternatives. So I go on to roll my own. In the past gpsbabel worked fine with my device but for some reason it is letting me down this time, probably to a weird RS232->USB converter. Fortunately gardump from garmin-utils from OpenBSD's ports tree works!
gardump's output is something like this:
[gardump version 2.4]
[product 574, version 260: Geko 201 Software Version 2.60]
[UTC 2011-10-08 10:37:28]
[waypoints, 3 records]
# **n [route name]
# lat long [A:alt] [S:sym] [D:display] [I:id] [C:cmnt] [W:wpt info] [L:link]
 47.610049   12.276759 A:1991.241455 S:178 D:0 I:001
 47.598639   12.272885 A:1533.897705 S:178 D:0 I:002
 47.592280   12.324192 A:1817.003906 S:178 D:0 I:003
[end transfer, 3/3 records]
[routes, 0 records]
# **n [route name]
# lat long [A:alt] [S:sym] [D:display] [I:id] [C:cmnt] [W:wpt info] [L:link]
[end transfer, 0/0 records]
[tracks, 10000 records]
# [Track: track name]
# [yyyy-mm-dd hh:mm:ss] lat long [alt] [start]
Track: ACTIVE LOG
2011-09-10 09:41:35  47.592945   12.179224 285.168213 start
2011-09-10 09:41:45  47.592903   12.179354 285.168213
2011-09-10 09:41:55  47.592880   12.179375 285.168213
2011-09-10 09:42:05  47.592880   12.179440 499.061523
# [...]
...and so on. For the plot getting the track points should suffice. I could use the excellent abnf egg, but for this oneshot hack it seems to be overkill (it always looks like this on the first go, doesn't it?). So I go for this:
(use extras miscmacros numbers srfi-1 posix plotter)

(define-record log-entry time lat long alt start?)

(define (active-log lines)
  (if (null? lines) '()
      (lines->log-entries
       (cdr (take-while
             (lambda (l) (not (eq? (string-ref l 0) #\[)))
             (drop-while (lambda (l)
                           (not (equal? "Track: ACTIVE LOG" l)))
                         lines))))))

(define (lines->log-entries lines)
  (let loop ((ls lines)
             (lgs '()))
    (cond ((null? ls)
           (reverse lgs))
          (else
           (let* ((e (string-split (car ls)))
                  (date (local-time->seconds (string->time (string-append (first e) " " (second e)) "%F %T")))
                  (lat (string->number (third e)))
                  (long (string->number (fourth e)))
                  (alt (string->number (fifth e)))
                  (start? (and (equal? (length e) 6) (string=? "start" (sixth e)))))
             (loop (cdr ls) (cons (make-log-entry date lat long alt start?) lgs)))))))
The usage of records turns out to be not really necessary but I just keep it for now. So now I have everything I need in a nice scheme-like format.
Open a window and draw...
I have heard nice things about the cairo graphics library and there is even a egg available for chicken. It promises to be able to output to SDL (for onscreen viewing), png, pdf and svg so let's use that!
Alas, you need to go through quite some hoops to get a simple window you can draw on! To be able to draw to the screen, one creates a SDL surface, builds a cairo surface and hands that to a cairo constructor that creates a so called cairo context which holds all the state necessary for cairo's drawing.
So once I have this context object, I can set text or draw lines and circles on it. That should be all that I need.
In code it looks like this:
(use cairo sdl miscmacros srfi-1)

(define-record win handle w h x-border y-border title sdl-surface image-surface)

(define black '(0 0 0 1))
(define red '(1 0 0 1))
(define green '(0 1 0 1))
(define blue '(0 0.2 0.9 1))

(define *font* "Vollkorn")
(define *grid-width* 2)
(define *circle* 3)

(sdl-init SDL_INIT_EVERYTHING)

(define (new-win w h title)
  (let* ((s (sdl-set-video-mode w h 0 (+ SDL_HWSURFACE
                                         SDL_HWPALETTE
                                         SDL_DOUBLEBUF)))
         (image-surface (cairo-image-surface-create-for-data
              (sdl-surface-pixels s)
              CAIRO_FORMAT_RGB24 w h
              (sdl-surface-pitch s)))
         (c (cairo-create image-surface)))
    (sdl-wm-set-caption title title)

    (cairo-set-source-rgba c 1 1 1 1)
    (cairo-rectangle c 0 0 w h)
    (cairo-fill c)
    (cairo-stroke c)
    (sdl-flip s)
    (make-win c w h 0.1 0.10 title s image-surface)))


(define (opacity color op)
  (if (= (length color) 3)
      (append color (list op))
      (append (take color 3) (list op))))

(define (draw-circle! win x y diameter color)
  (let ((stroke-color (opacity color 1))
        (fill-color (opacity color 0.6)))
    (apply cairo-set-source-rgba `(,(win-handle win) ,@stroke-color))
    (cairo-arc (win-handle win) x y (/ diameter 2) 0 (* 2 cairo-pi))
    (cairo-stroke (win-handle win))
    (apply cairo-set-source-rgba `(,(win-handle win) ,@fill-color))
    (cairo-arc (win-handle win) x y (/ diameter 2) 0 (* 2 cairo-pi))
    (cairo-fill (win-handle win))))

(define (draw-line! win x1 y1 x2 y2 color width)
  (apply cairo-set-source-rgba `(,(win-handle win) ,@color))
  (doto (win-handle win)
        (cairo-new-path)
        (cairo-move-to x1 y1)
        (cairo-set-line-width width)
        (cairo-line-to x2 y2)
        (cairo-stroke)))

(define (draw-text! win text x y font size color)
  (apply cairo-set-source-rgba `(,(win-handle win) ,@color))
  (doto (win-handle win)
        (cairo-move-to x y)
        (cairo-set-font-size size)
        (cairo-select-font-face font CAIRO_FONT_SLANT_NORMAL CAIRO_FONT_WEIGHT_NORMAL)
        (cairo-show-text text)))

(define (show! win)
  (sdl-flip (win-sdl-surface win)))
Putting the values on fixed coordinates
So now that we can draw, we need to map our GPS and elevation data to our canvas grid. I have used a simple mapping function for this:
; remaps a value from a [source-low;source-high] to the
; [target-low;target-high] interval
(define (remap value source target)
  (let ((source-low (car source))
        (source-high (cadr source))
        (target-low (car target))
        (target-high (cadr target)))
    (round (+ target-low
              (* (- target-high target-low)
                 (/ (- value source-low)
                    (- source-high source-low)))))))
Which is applied to all coordinates i get out of the SEXPs from above:
; walks the list once and returns its '(min max)
(define (min-max lst)
  (fold (lambda (c s)
          (list (min c (car s))
                (max c (cadr s))))
        (list +inf.0 -inf.0)
        lst))

; remaps a list of (x y) coordinates to the new range
(define (xy-remap lst x-range-target y-range-target)
  (let* ((xs (map car lst))
        (ys (map cadr lst))
        (x-src (min-max xs))
        (y-src (min-max ys)))
    (map (lambda (x y)
           (list (remap x x-src x-range-target)
                 (remap y y-src y-range-target)))
         xs ys)))
Now the boring part is adjusting the coordinates to some offset to get enough space for the x- / y-axis and their labels, as well as adjusting the Y-coordinate as our coordinate system for the graph starts in the lower left corner. I have wrapped all this into two convenience procedures simple-draw and draw-simple-axes. Both take a cairo window object, all data points as a list. draw-simple-axes additionally expects a filter procedure for the x-axis and for the y-axis respectively as well as a printer procedure for the y-axis. The latter is needed for being able to label the elevation at convenient units such as 500m , 1500m, 2000m and so on. Everything together is used like this:
(define (simple-log win log)
  (let ((lst (log->lst log)))
    (simple-draw win lst)
    (draw-simple-axes win
                      lst
                      (lambda (v) (= 0 (modulo v (* 60 60 24))))
                      (lambda (v) (time->string (seconds->utc-time v) "%v"))
                      (lambda (v) (= 0 (modulo v 250)))
                      (lambda (v) (string-append (->string (inexact->exact v)) "m")))))
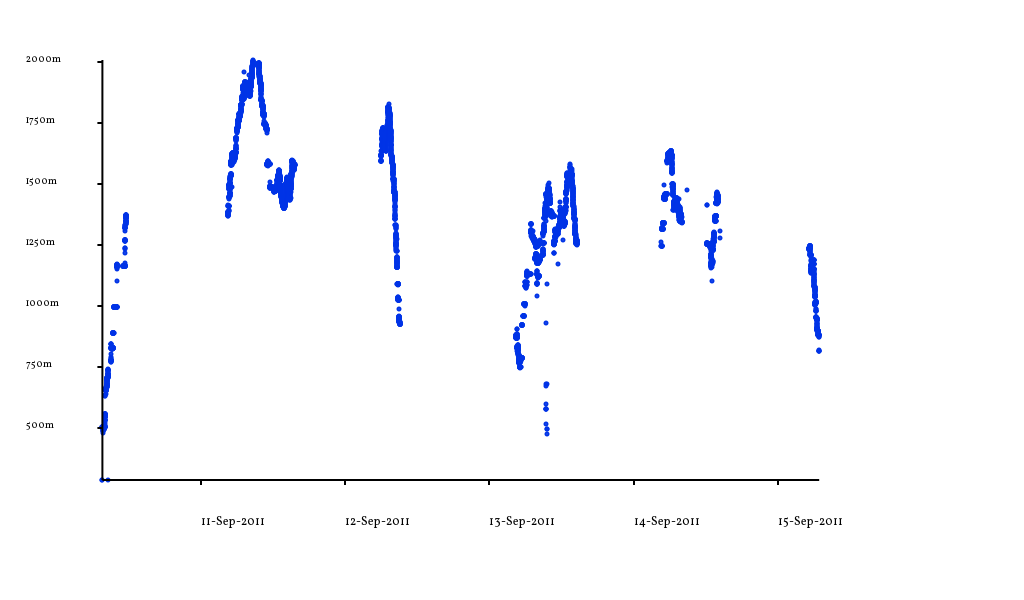
The result
And finally, we use the write-to-png procedure and get a nice plot of our hiking trip:
The code
All the code is BSD licensed and available as git repository from bitbucket:
https://bitbucket.org/ckeen/plotter
Further work...
Well there is lots that could be done...the code is definitely not the best I ever wrote. One could also improve smoothing the point sets as well as fixing some corner cases of the "layout" code.
Conclusion
Wrapping around the cumbersome cairo or SDL egg allows easy plotting of data. I definitely want to explore this in more detail. I hope you have enjoyed the ride so far. Please leave feedback at the usual place.